The Top Ranking dashboard aims to offer an overview of both the highest-performing delivered assets and those that were not delivered due to internal server errors.
Steps to find volumetry:CL
1- Open Admin Panel
2- Press on Top Ranking under STATS & LOGS
Graph: Top 30 assets delivered in the last 24hrs: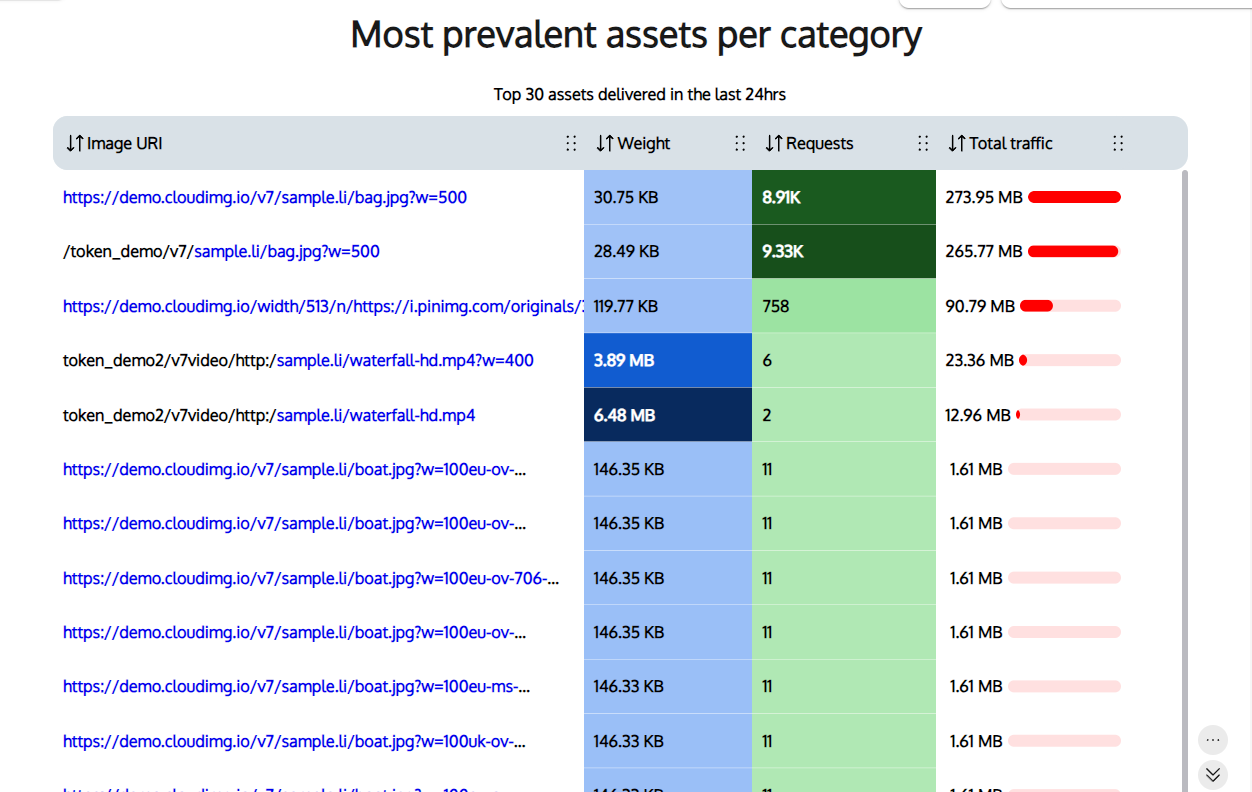
The purpose of this table is to present the aggregate data for the most frequently delivered assets in the past 24 hours, including the total number of requests, Asset Weight, and overall traffic.
This table is designed to showcase assets that experienced delivery failures due to internal server errors.
It includes information on the response code and the frequency of occurrences within the last 7 days.
If you have any questions or issues, please feel free to contact our Software Engineer and mention the following:
- Token
- Short description of the issue (including URLs, screenshot, short video if available)
- Steps to reproduce the issue.
Comments
Please sign in to leave a comment.